Usage
Shows token, cost and speed usage for your OpenCode, Codex and Antigravity sessions over the last day, week, month or all time.

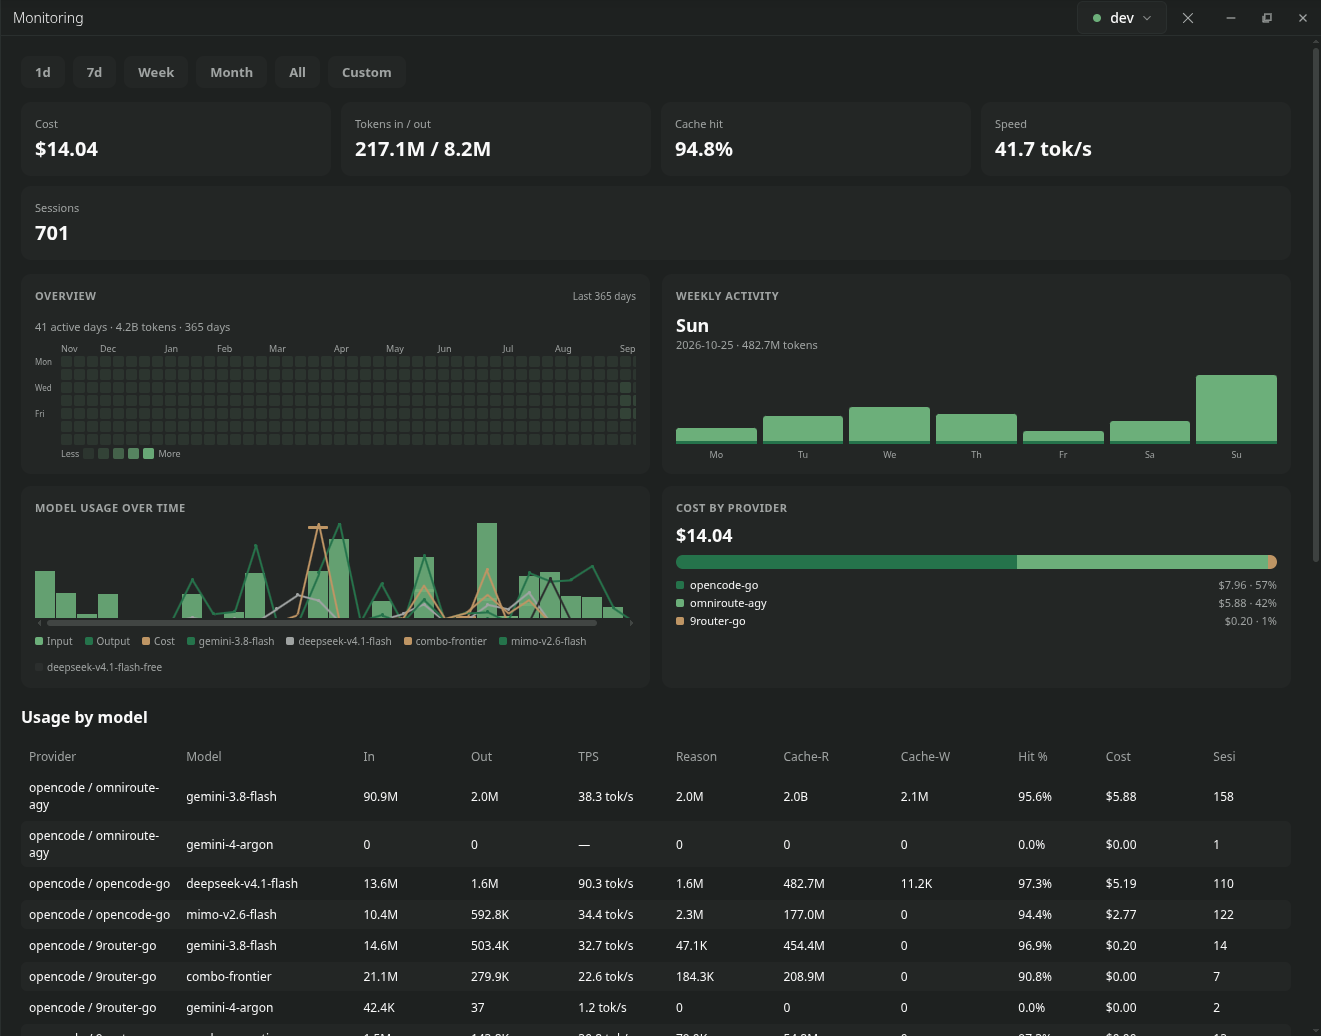
Token and cost usage across every backend this machine has used, broken down per provider and model. It reads the local OpenCode session database (~/.local/share/opencode/opencode.db) and Codex rollout files (~/.codex/sessions/*.jsonl), aggregates input, output, reasoning, cache-read and cache-write tokens plus cost, and shows the result on a Usage screen in Paseo with 1d, 7d, 30d and all-time periods.
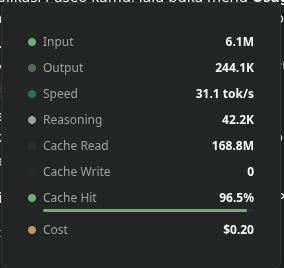
The OpenCode adapter reads both database generations: v2 sessions live in session_v2 (messages in session_message), v1 in session/message, and v2's migrated legacy rows are counted once. Output speed (TPS) mirrors OpenCode's own metric: output plus reasoning tokens divided by the streaming window (time.streamed minus time.created), so tool runtime and permission waits never inflate the denominator; sessions without a streaming timestamp show a dash instead of a fabricated zero. TPS appears as an overview card, a model-table column, and in the composer pill detail-card.
Each session row is counted exactly once: OpenCode rows come from session_v2 when present and from session on v1 databases, with legacy-only rows unioned in (provider comes from the model's providerID), and each Codex rollout file contributes its final cumulative token count. Codex sessions carry no cost data, so cost covers OpenCode providers only. Antigravity conversation stores are plain SQLite and are read for session and step counts; their gen_metadata blobs are protobuf and decode to real per-generation token totals per model plus the latest context occupancy (cache and cost are not recorded locally and stay honest zeros). Token usage for running sessions is also captured by agy-usage-proxy, a local gateway the plugin points new Antigravity spawns at via the AGY_LLM_GATEWAY_URL environment variable, and used for per-session pill attribution by conversation id. One known gap sits outside this plugin: the built-in Paseo "Context window" composer widget reads context occupancy from the agent state that only a provider integration itself reports, and the bundled Antigravity (CLI) provider does not report it today - so the widget can show "No context data" for CLI-harness agents even though this plugin has the numbers (ACP-based Antigravity agents are fed by their server). Filling that widget from plugin data needs a daemon API that does not exist yet.
All data sources are opened read-only and are never written to. Aggregated results are cached for five minutes per period; pull to refresh forces re-aggregation. No credentials are read or logged.
Entry points
Every entry shows the same Usage view (period selector, overview cards, dashboard, model table, coverage):
| Entry | Where it appears |
|---|---|
| Search / Command Center "Open Monitoring" | ⌘K / Ctrl+K on every client, including mobile - the primary way in |
| Sidebar header row | Desktop sidebar header (single entry; no footer duplicate) |
| Composer pill detail card | Per-agent track bar: the label shows input/output and cache hit; tap opens a compact metric card (input, output, speed, reasoning, cache read/write, cache hit with a progress bar, cost; daily fallback when the session is untracked). Info only - open Monitoring via Search or the sidebar |
The plugin intentionally registers no workspace panel, so no "Monitoring" entry appears in the + menu; Search is the cross-platform entry point. |
Troubleshooting
The screen, sidebar item, and composer pill only appear on clients connected to a daemon where this plugin is installed and running.
- The screen header has a host picker. If several daemons are connected, confirm the selected host is the machine where the plugin is installed.
- If the sidebar row is missing, check Settings → Sidebar: plugin sidebar items can be hidden there.
- On the daemon machine, run
paseo plugin ls: theusagerow must showrunningwith an empty ERROR column.paseo plugin logs usageshows daemon-side output ("Plugin ready" on a healthy start). - The composer pill requires the agent to belong to a workspace (agents without a workspace cannot carry pills by API design) and the client must render composer pills at all; on hosts that do not render them, the screen and sidebar item still work.
- Mobile clients connect to their own configured daemon. If that daemon is not the machine with the data, install the plugin there as well; usage data is local to each machine.